Live tables on housing market and house prices
The latest data tables on housing market and house prices.
- From:
- Ministry of Housing, Communities & Local Government
- Published
- 10 November 2012
- Last updated
- 14 July 2016 — See all updates
These statistics are no longer updated by DCLG.
The equivalents of tables 581 to 588 are now published by the Office for National Statistics in the house price statistics for small areas series and tables 576 to 578 in the housing affordability series.
Discontinued tables
Tables 531, 542, 563, 575 and 580 have been discontinued and are no longer being updated.
Table 531: distribution of house prices, by new/other dwellings and type of buyer, United Kingdom, from 1990 (final version)
MS Excel Spreadsheet, 91 KB
This file may not be suitable for users of assistive technology.
Request an accessible format.
Table 542: mortgage lending by type of lender, United Kingdom, from 1990 (final version)
MS Excel Spreadsheet, 23.5 KB
This file may not be suitable for users of assistive technology.
Request an accessible format.
Table 563: average valuations of residential building land with outline planning permission (final version)
MS Excel Spreadsheet, 37.5 KB
This file may not be suitable for users of assistive technology.
Request an accessible format.
Table 575: ratio of lower quartile house price to lower quartile earnings, England, from 1996 (quarterly) (final version)
MS Excel Spreadsheet, 48.5 KB
This file may not be suitable for users of assistive technology.
Request an accessible format.
Table 580: 15-percentile house prices based on Land Registry data, by district and HMR pathfinder area, from 1996 (quarterly) (final version)
MS Excel Spreadsheet, 303 KB
This file may not be suitable for users of assistive technology.
Request an accessible format.
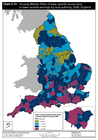
Chart 574: ratio of lower quartile house price to lower quartile earnings by local authority, 2007, England
PDF, 921 KB, 1 page
This file may not be suitable for users of assistive technology.
Request an accessible format.
Chart 575: ratio of lower quartile house price to lower quartile earnings by local authority, from 1997, England
PDF, 2.32 MB, 17 pages
This file may not be suitable for users of assistive technology.
Request an accessible format.

Chart 576: ratio of median house price to median earnings by local authority, from 1997, England
PDF, 2.34 MB, 17 pages
This file may not be suitable for users of assistive technology.
Request an accessible format.
Tables no longer updated by DCLG
The following tables will no longer be updated by the Department for Communities and Local Government. They will now be updated by the Office for National Statistics or HM Revenue and Customs (see individual tables for details).
Table 502: house prices from 1930, annual house price inflation, United Kingdom, from 1970
MS Excel Spreadsheet, 33.5 KB
This file may not be suitable for users of assistive technology.
Request an accessible format.
Table 503: simple average house prices by new/other dwellings, type of buyer and region, United Kingdom, from 1986
MS Excel Spreadsheet, 76 KB
This file may not be suitable for users of assistive technology.
Request an accessible format.
Table 504: simple average house prices, by new/other dwellings, type of buyer and region, United Kingdom, from 1992 (quarterly)
MS Excel Spreadsheet, 272 KB
This file may not be suitable for users of assistive technology.
Request an accessible format.
Table 505: simple average house prices, by new/other dwellings, type of buyer and standard statistical regions, from 1969
MS Excel Spreadsheet, 123 KB
This file may not be suitable for users of assistive technology.
Request an accessible format.
Table 506: simple average house prices, by new/other dwellings, type of buyer and standard statistical region, from 1990 (quarterly).
MS Excel Spreadsheet, 273 KB
This file may not be suitable for users of assistive technology.
Request an accessible format.
Table 507: mix-adjusted house prices, by new/other dwellings, type of buyer and region, United Kingdom, from 1993
MS Excel Spreadsheet, 82 KB
This file may not be suitable for users of assistive technology.
Request an accessible format.
Table 508: mix-adjusted house prices, by new/other dwellings, type of buyer and region, United Kingdom, from 1992 (quarterly)
MS Excel Spreadsheet, 237 KB
This file may not be suitable for users of assistive technology.
Request an accessible format.
Table 511: simple average house prices, by dwelling type and region, United Kingdom, from 1986
MS Excel Spreadsheet, 62.5 KB
This file may not be suitable for users of assistive technology.
Request an accessible format.
Table 512: simple average house prices, by dwelling type and standard statistical region, United Kingdom, from 1983
MS Excel Spreadsheet, 64 KB
This file may not be suitable for users of assistive technology.
Request an accessible format.
Table 513: simple average house prices, mortgage advances and incomes of borrowers, by new/other dwellings, type of buyer and region, United Kingdom, from 1986
MS Excel Spreadsheet, 170 KB
This file may not be suitable for users of assistive technology.
Request an accessible format.
Table 514: simple average house prices, mortgage advances and incomes of borrowers, by new/other dwellings, type of buyer and region, United Kingdom, from 1992 (quarterly)
MS Excel Spreadsheet, 345 KB
This file may not be suitable for users of assistive technology.
Request an accessible format.
Table 515: simple average house prices, mortgage advances and incomes of borrowers, by new/other dwellings, type of buyer and standard statistical region, from 1969
MS Excel Spreadsheet, 154 KB
This file may not be suitable for users of assistive technology.
Request an accessible format.
Table 516: simple average house prices, mortgage advances and incomes of borrowers, by new/other dwellings, type of buyer and standard statistical region, from 1992 (quarterly)
MS Excel Spreadsheet, 298 KB
This file may not be suitable for users of assistive technology.
Request an accessible format.
Table 517: ratios of simple average house prices, mortgage advances and incomes of borrowers, by new/other dwellings and type of buyer, United Kingdom, from 1969
MS Excel Spreadsheet, 73.5 KB
This file may not be suitable for users of assistive technology.
Request an accessible format.
Table 521: annual house price inflation, comparison of Communities and Local Government, Land Registry, Halifax and Nationwide estimates, United Kingdom, (quarterly) from 1984
MS Excel Spreadsheet, 39 KB
This file may not be suitable for users of assistive technology.
Request an accessible format.
Table 523: annual house price growth, comparison of Communities and Local Government, Land Registry, Halifax and Nationwide estimates, United Kingdom, (quarterly) from 2005 (chart)
MS Excel Spreadsheet, 42 KB
This file may not be suitable for users of assistive technology.
Request an accessible format.
Table 530: number of residential and non-residential property transactions with a value of £40,000 or more, United Kingdom
MS Excel Spreadsheet, 47 KB
This file may not be suitable for users of assistive technology.
Request an accessible format.
Table 532: distribution of house prices, by new/other dwellings and type of buyer, United Kingdom, from 2006
MS Excel Spreadsheet, 37 KB
This file may not be suitable for users of assistive technology.
Request an accessible format.
Table 534: distribution of dwelling types with mortgage, by new/other dwellings and type of buyer, United Kingdom, from 1990
MS Excel Spreadsheet, 69 KB
This file may not be suitable for users of assistive technology.
Request an accessible format.
Table 535: distribution of mortgage advances, United Kingdom, from 1990
MS Excel Spreadsheet, 41 KB
This file may not be suitable for users of assistive technology.
Request an accessible format.
Table 536: distribution of mortgage periods, United Kingdom, from 1990
MS Excel Spreadsheet, 87 KB
This file may not be suitable for users of assistive technology.
Request an accessible format.
Table 537: distribution of borrowers' ages, by new/other dwellings and type of buyer, United Kingdom, from 1990
MS Excel Spreadsheet, 114 KB
This file may not be suitable for users of assistive technology.
Request an accessible format.
Table 538: distribution of borrowers' incomes, United Kingdom, from 1990
MS Excel Spreadsheet, 98 KB
This file may not be suitable for users of assistive technology.
Request an accessible format.
Table 539: repayments as a percent of income and deposit as a percent of purchase price, by type of buyer, United Kingdom, from 1988
MS Excel Spreadsheet, 35 KB
This file may not be suitable for users of assistive technology.
Request an accessible format.
Table 540: deposit as a percent of purchase price, by type of buyer, United Kingdom, from 1988 (chart)
MS Excel Spreadsheet, 43 KB
This file may not be suitable for users of assistive technology.
Request an accessible format.
Table 544: number of mortgage advances, average advance, average house price, by type of lender, United Kingdom, from 1990
MS Excel Spreadsheet, 30.2 KB
This file may not be suitable for users of assistive technology.
Request an accessible format.
Table 557: comparison of mix-adjusted mean and median, by region, United Kingdom, from quarter 2, 2002 (quarterly)
MS Excel Spreadsheet, 86.5 KB
This file may not be suitable for users of assistive technology.
Request an accessible format.
Table 571: simple average house prices, United Kingdom (chart)
MS Excel Spreadsheet, 34.5 KB
This file may not be suitable for users of assistive technology.
Request an accessible format.
Table 572: latest year on year percentage change in mix-adjusted house prices, by region (chart)
MS Excel Spreadsheet, 19 KB
This file may not be suitable for users of assistive technology.
Request an accessible format.
Tables 576 to 578: ratio of house price to earnings (lower quartile and median) by local authority, from 1997 (final version)
MS Excel Spreadsheet, 360 KB
This file may not be suitable for users of assistive technology.
Request an accessible format.
Table 581: mean house prices based on Land Registry data, by district, from 1996 (quarterly)
MS Excel Spreadsheet, 502 KB
This file may not be suitable for users of assistive technology.
Request an accessible format.
Table 582: median house prices based on Land Registry data, by district, from 1996 (quarterly)
MS Excel Spreadsheet, 249 KB
This file may not be suitable for users of assistive technology.
Request an accessible format.
Table 583: lower quartile house prices based on Land Registry data, by district, from 1996 (quarterly)
MS Excel Spreadsheet, 250 KB
This file may not be suitable for users of assistive technology.
Request an accessible format.
Table 584: property sales based on Land Registry data, by district, from 1996 (quarterly)
MS Excel Spreadsheet, 248 KB
This file may not be suitable for users of assistive technology.
Request an accessible format.
Table 585: mean house prices based on Land Registry data, by district, from 1996
MS Excel Spreadsheet, 204 KB
This file may not be suitable for users of assistive technology.
Request an accessible format.
Table 586: median house prices based on Land Registry data, by district, from 1996
MS Excel Spreadsheet, 125 KB
This file may not be suitable for users of assistive technology.
Request an accessible format.
Table 587: lower quartile house prices based on Land Registry data, by district, from 1996
MS Excel Spreadsheet, 124 KB
This file may not be suitable for users of assistive technology.
Request an accessible format.
Table 588: property sales based on Land Registry data, by district, from 1996
MS Excel Spreadsheet, 124 KB
This file may not be suitable for users of assistive technology.
Request an accessible format.
Table 590: mix-adjusted house price index, by region, from quarter 2 1968 (quarterly) and from 2002 (monthly)
MS Excel Spreadsheet, 186 KB
This file may not be suitable for users of assistive technology.
Request an accessible format.
Table 591: mix-adjusted house price index, by region, from quarter 2 1968 (quarterly)
MS Excel Spreadsheet, 150 KB
This file may not be suitable for users of assistive technology.
Request an accessible format.
Table 592: mix-adjusted house prices, by new/pre-owned dwellings, type of buyer and region, from February 2002
MS Excel Spreadsheet, 340 KB
This file may not be suitable for users of assistive technology.
Request an accessible format.
Table 593: mix-adjusted house prices index and inflation, by new/other dwellings, type of buyer and region, from 1969
MS Excel Spreadsheet, 197 KB
This file may not be suitable for users of assistive technology.
Request an accessible format.
Table 594: mix-adjusted house price index and inflation, by new/other dwellings, type of buyer and region, from quarter 2 1968
MS Excel Spreadsheet, 632 KB
This file may not be suitable for users of assistive technology.
Request an accessible format.
Last updated 14 July 2016 + show all updates
-
Tables 576 to 578 updated.
-
Tables 576 to 578 updated.
-
Updated tables 544, 576, 577, 578, 581, 582, 583, 584, 585, 586, 587 and 588. Added new charts 575 and 576. Discontinued tables 531, 542, 563, 575 and 580.
-
Updated tables 576, 577 and 578.
-
First published.